

Your board wants to see MRR trends. You want to see MRR breakdowns by segment, understand what your good fit customers are, and what’s driving recent churns.
The answer should live in HubSpot—your CRM is where RevOps, sales, and success teams actually work. But getting clean, board-ready MRR reporting into HubSpot isn't as simple as syncing Stripe data and calling it done.
Here's how to build MRR reporting that actually works: historical trends, current snapshots, retention metrics, and operational lists. (If you're wondering why "just syncing Stripe" doesn't work, we wrote about where DIY integrations break here.)
Prerequisites: The Data Foundation
Board-ready reporting within HubSpot requires accurate MRR data. That means:
A current view of MRR for every active subscription as of today
MRR change events for every subscription change (new, upgrade, downgrade, churn)
Historical reconstruction, so you can show trends over time
Multi-currency normalization if you operate globally
Logic that accounts for edge cases like one-time payments, recurring and one-time discounts, prorations, refunds, and invoice and subscription statuses.
You can't build reliable reports on unreliable data. (This is why the "Zapier integration" approach falls apart; webhook syncs don't handle MRR transformation logic. We dove deep into why MRR calculations are deceptively complex if you want to see just how many edge cases exist.)
For this tutorial, we're using ClearSync because it handles these data transformations automatically and creates the right HubSpot objects for reporting. To follow along, you'll need:
ClearSync connected to your Stripe & HubSpot accounts (14-day free trial)
Historical Stripe data imported to HubSpot (happens automatically during setup)
HubSpot reporting access
Once the data foundation is in place, building these reports takes about an hour.
And once you do build these reports, you’ll better understand what other reports you might want to build and how other teams can use them. For example:
Your CS team can use the failed payments list daily
Your AEs can track expansions in real-time
Your RevOps team can answer exec-level questions without waiting for the next board meeting data refresh
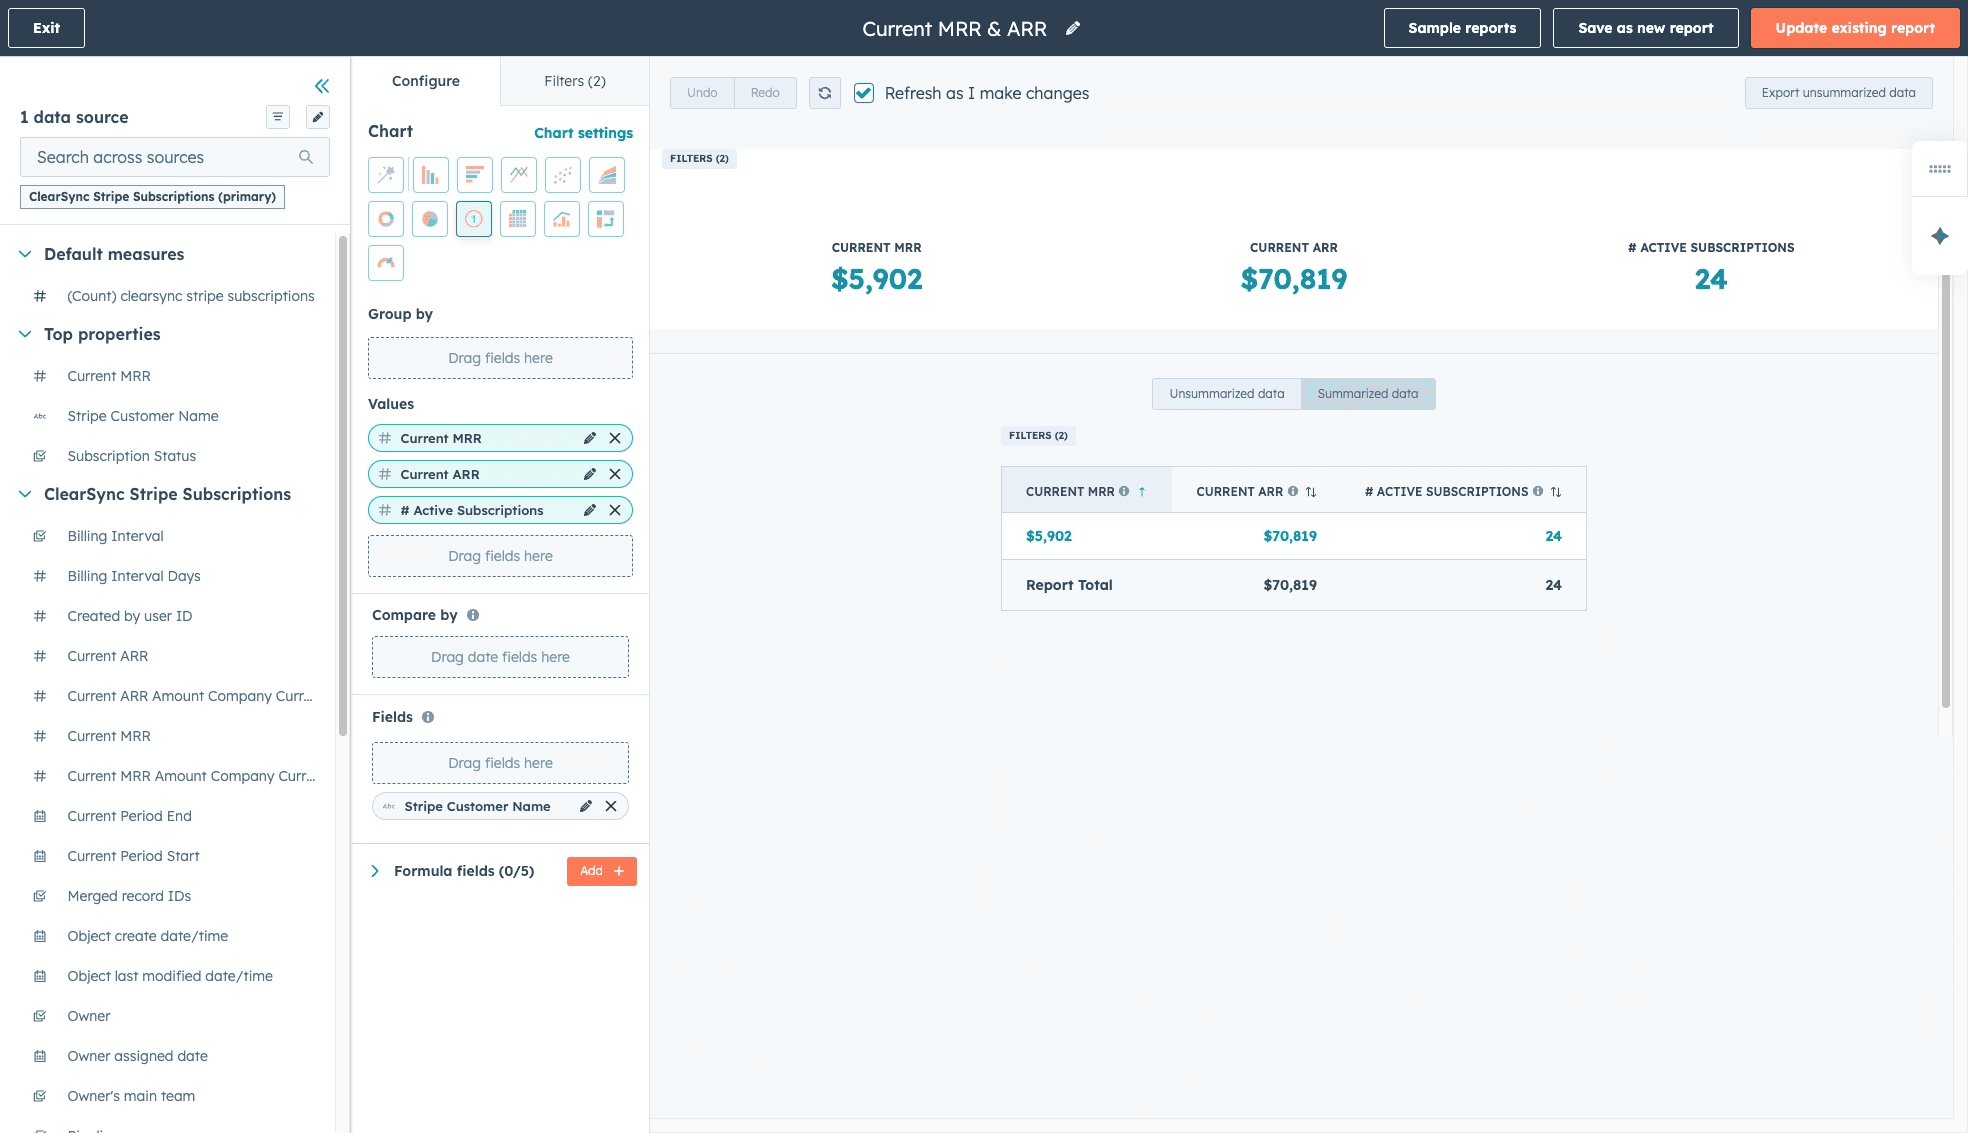
Report 1: Current MRR, ARR, and Active Subscription Snapshot
Founders and boards need the headline number: what's our MRR/ARR right now?
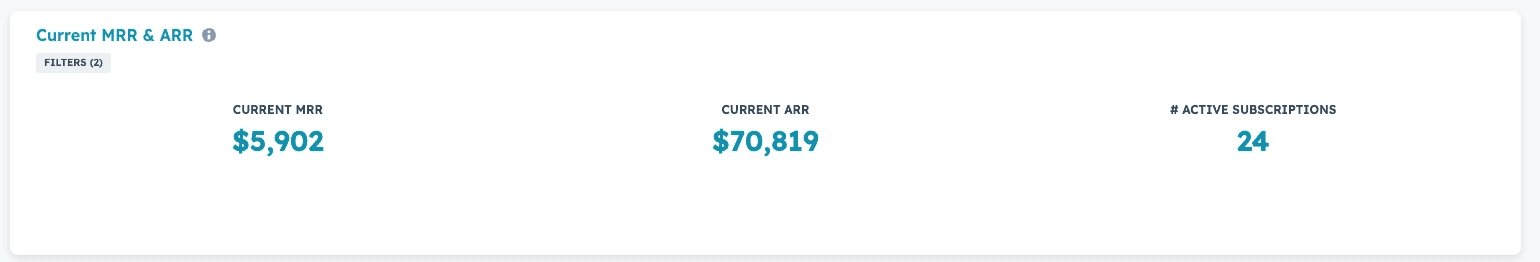
What you're building: A KPI card showing total current MRR & ARR across all active subscriptions.
Step-by-step:
In HubSpot, go to Reports > Create Report
Select Custom Report > set Primary Data Source to ClearSync Stripe Subscriptions
Click Next, then configure:
(A) Chart type: Select KPI in visualization options
(B) Values: Drag in Current MRR, Current ARR, and (Count) ClearSync Stripe Subscriptions. (You can rename it to “# Active Subscriptions” for clarity, which is what we did here)
(C) Fields: Drag in Stripe Customer Name
(D) Filters: Set Current ARR is greater than 0 and Subscription Status is any of “Active” to filter by only the paying, active customers
Save report as "Current MRR & ARR"
Board context: This goes on your cover slide and in every board deck. It's the number everyone asks about first.
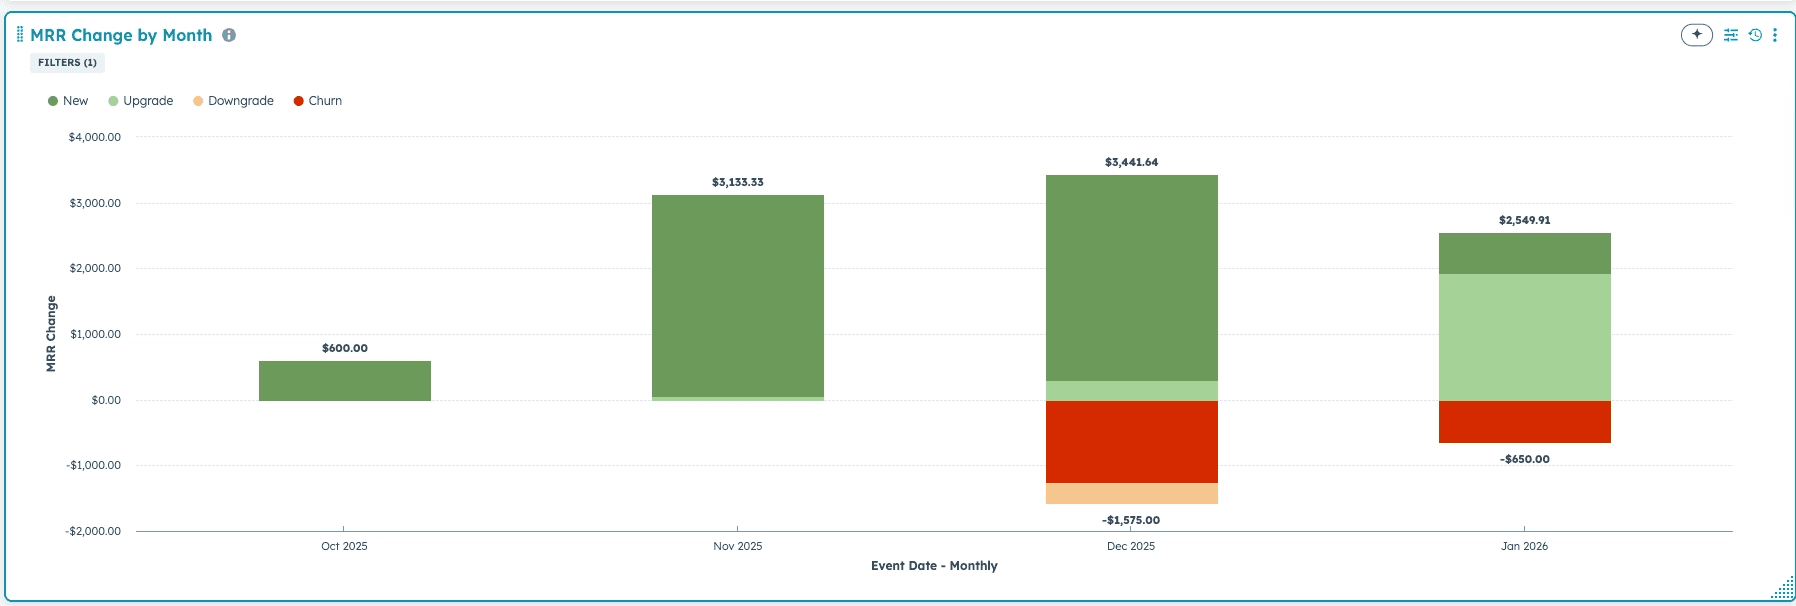
Report 2: Historical MRR Trends
Founders, teams, and boards want to see MRR movement over time, broken down by category: new business, expansion, contraction, and churn.
What you're building: A combination chart showing MRR change month-over-month, color-coded by revenue category. This answers: "Are we growing? Where's the growth coming from?"
Step-by-step:
In HubSpot, go to Reports > Create Report
Select Custom Report > set Primary Data Source to ClearSync Stripe Events
Click Next, then configure:
(A) Chart type: Select Vertical Bar in visualization options
(B) X-axis: Drag Event Date into X-axis
(C) Y-axis: Drag MRR Change into Y-axis
(D) Break down by: Drag Event MRR Type (this gives you New/Upgrade/Downgrade/Churn categories)
(E) (Optional) Fields: Drag Stripe Customer Name and/or Stripe Customer Domain
Save as "MRR Change by Month"
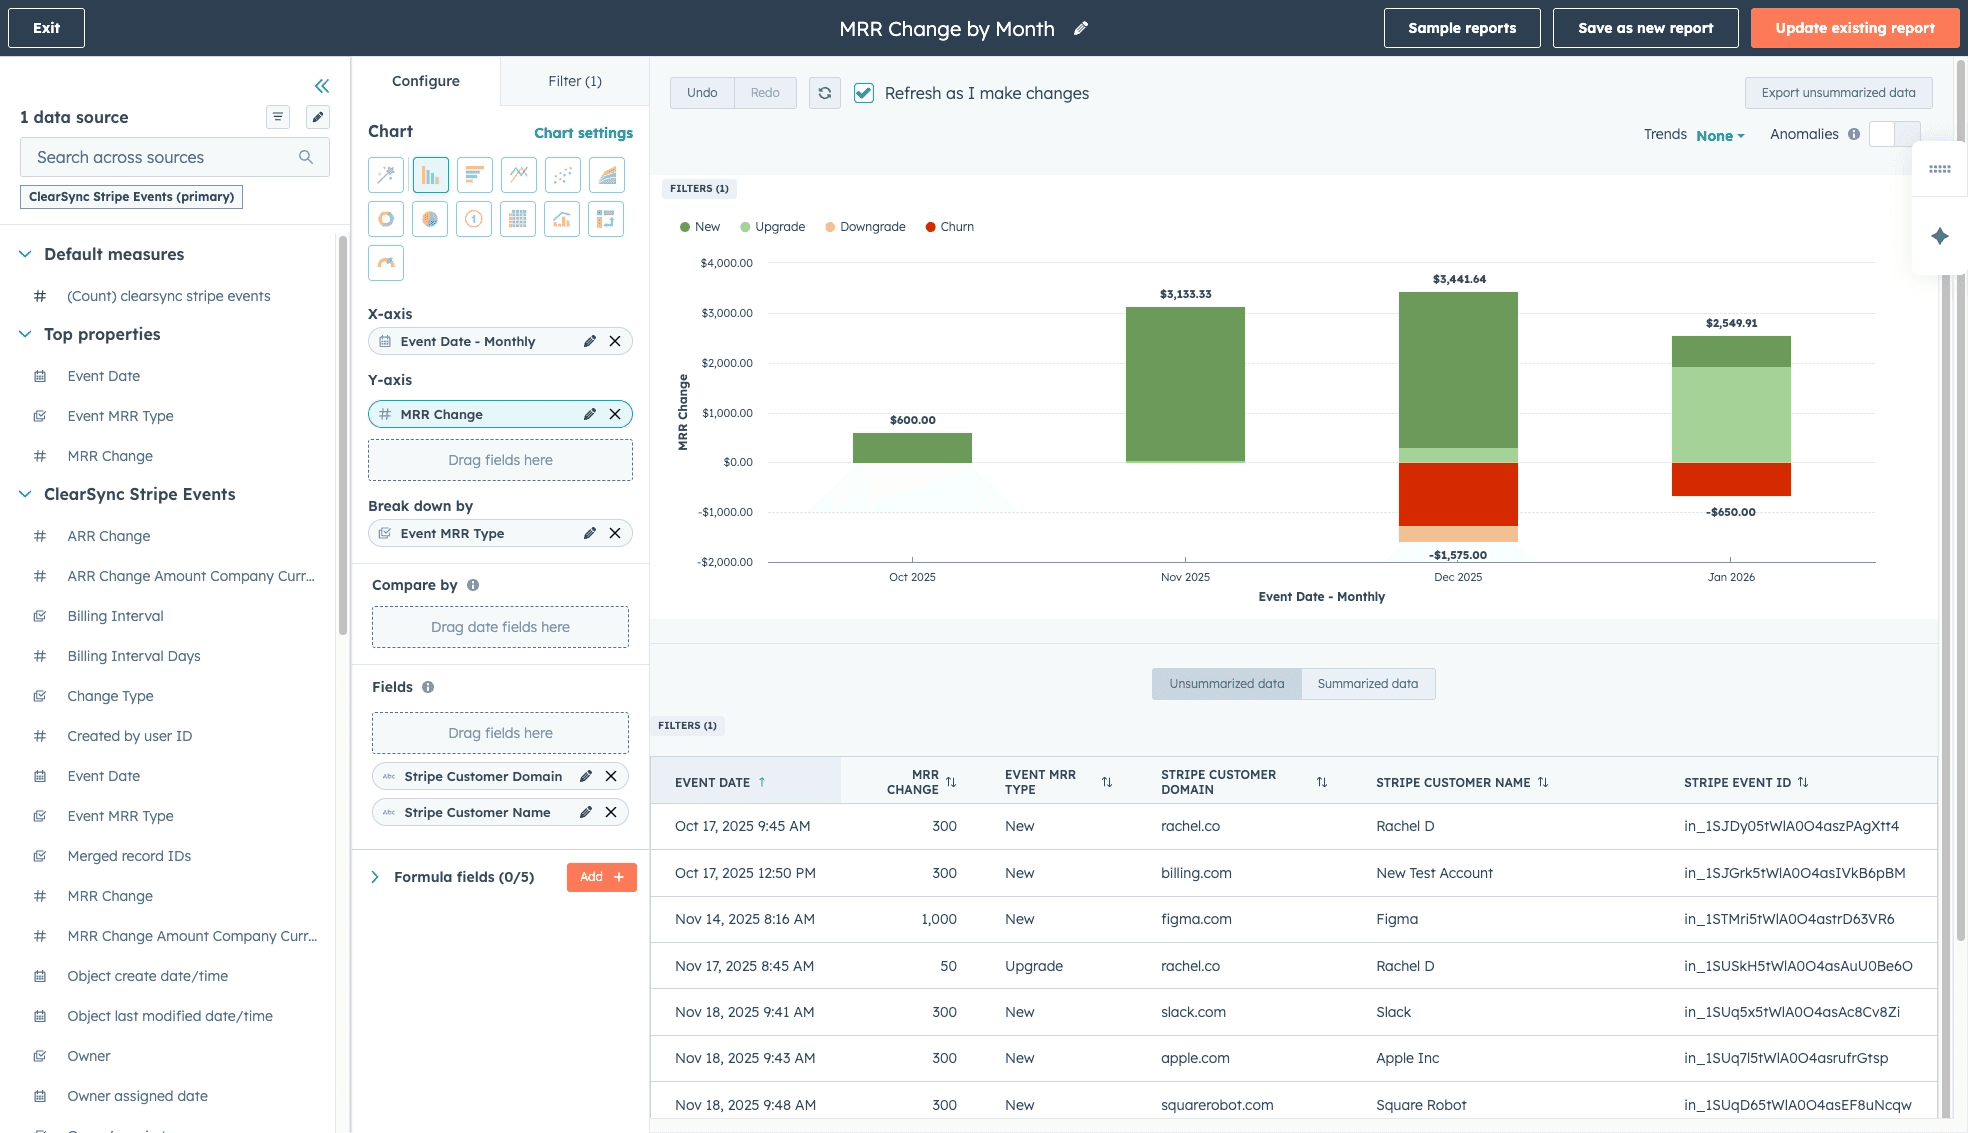
What this shows:
Light & dark green bars = new business and upgrades
Yellow & red bars = downgrades and churn
MRR Change = your actual MRR growth, in absolutes and percentages
The drill-down capability: Click into any bar segment (e.g., "Churn - January"), and HubSpot shows you the specific customers and subscription changes that make up that number. This is critical when someone asks "who churned?" or "which customers expanded?". You can always answer in real-time.
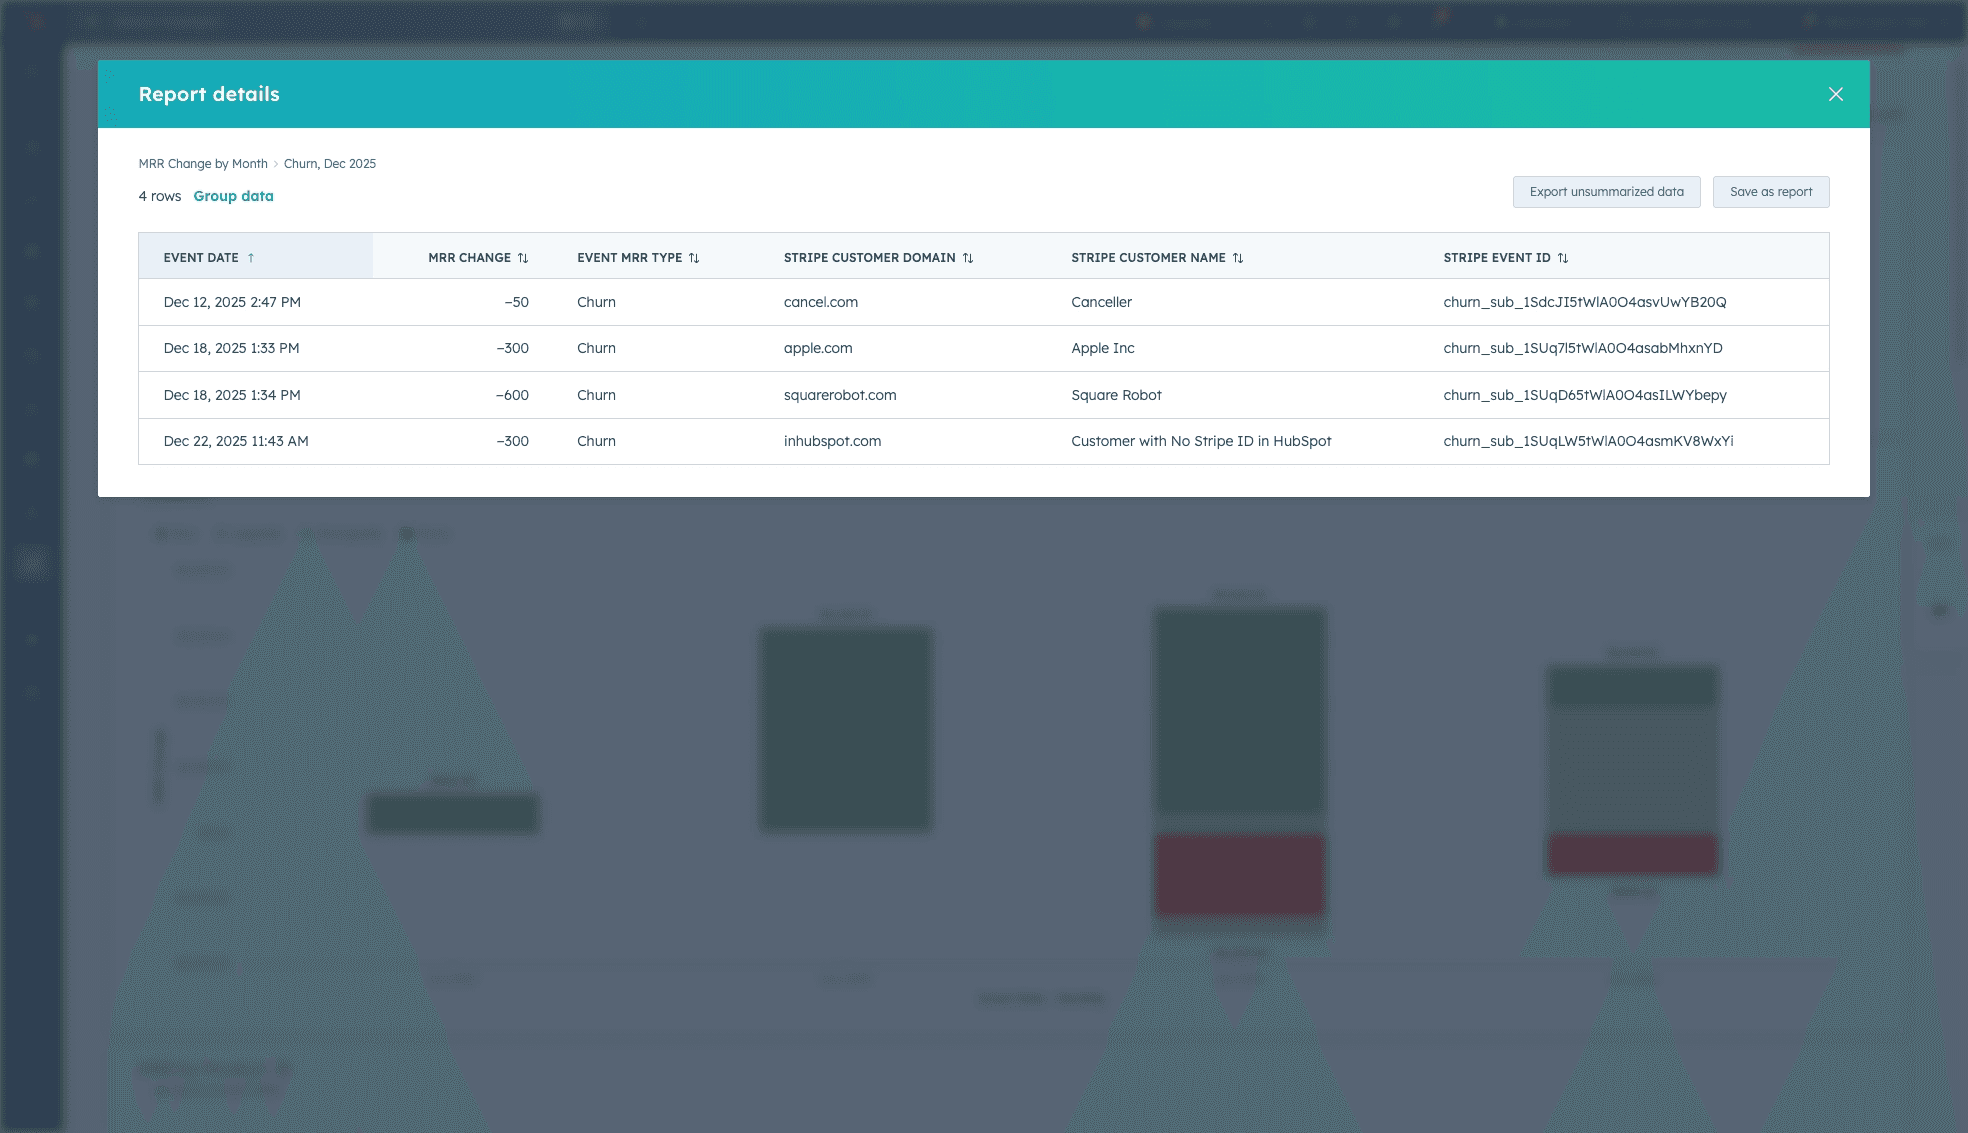
Board context: This is the first slide in your revenue deck. It shows if growth is accelerating or slowing, and whether churn is eating your expansion.
Report 3: MRR by Any Segment
As a founder, knowing which segments are growing and why is core to understanding your business. You need MRR broken down by whatever matters to your business, for example: industry, company size, product line, geography, sales rep. Getting the revenue data into HubSpot where your customer data and GTM team lives is critical for answering these questions.
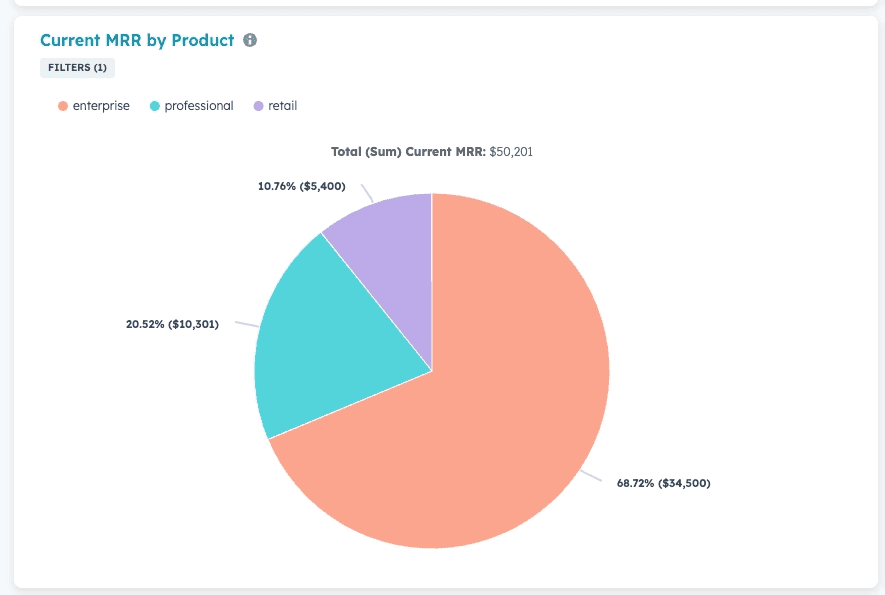
What you're building: A pie chart showing MRR by specific segment, such as product line or industry.
How it works: ClearSync's subscription data lives on the ClearSync subscription object, but your segmentation fields (industry, employee count, region) likely live on the HubSpot Company object. You need to report on both objects to segment the data in ways you might want.
Step-by-step (as an example, this will show you how to view your revenue by product. What you want to see will vary depending on how your Company data is structured in HubSpot):
Go to Reports > Create Report
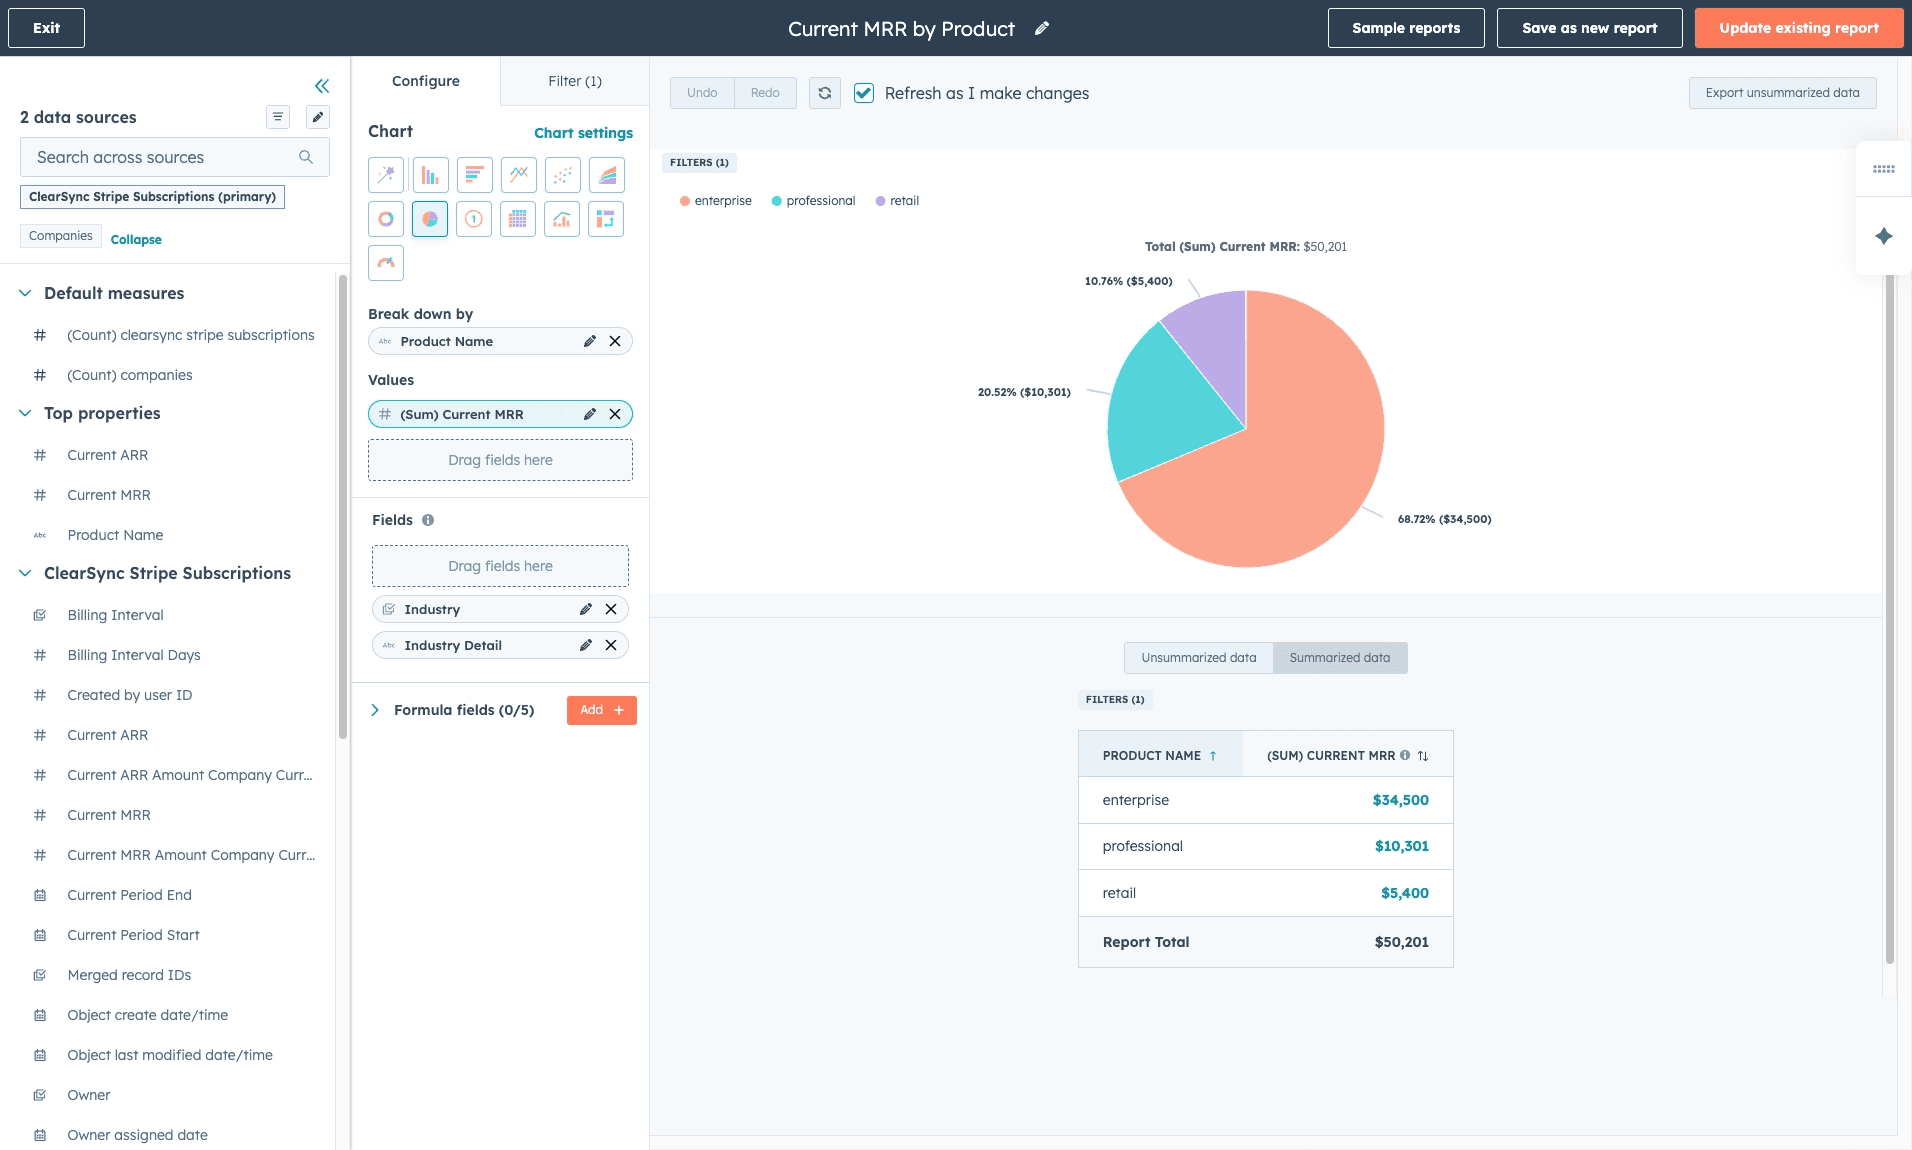
Select Custom Report > set Primary Data Source to ClearSync Stripe Subscriptions and add Companies as an additional data source
Click Next, then configure:
(A) Chart type: Select Pie in visualization options
(B) Values: Drag in Current MRR
(C) Break down by: Drag in Product Name (You might also choose Industry or Company Owner, for example)
(D) Fields (optional): Drag in things you might want to see in more detail from the Company object like Industry, Annual Revenue, or Company Size
(E) Filters: Set Current MRR is greater than 0 to filter by only paying customers
Save report as "Current MRR by Product"
Clone and make as many of these reports as you need, broken down by different pieces of data.
Board context: This answers "where should we invest more?" and "which segments are working?" which are critical for strategic planning.
Report 4: Churn Analysis
Every board asks: "Who churned this quarter and where is the churn coming from?"
What you're building: Two views that answer these questions: (1) a detailed list of churned customers with context, and (2) a breakdown showing which segments are driving churn.
Part A: Churned Customers List
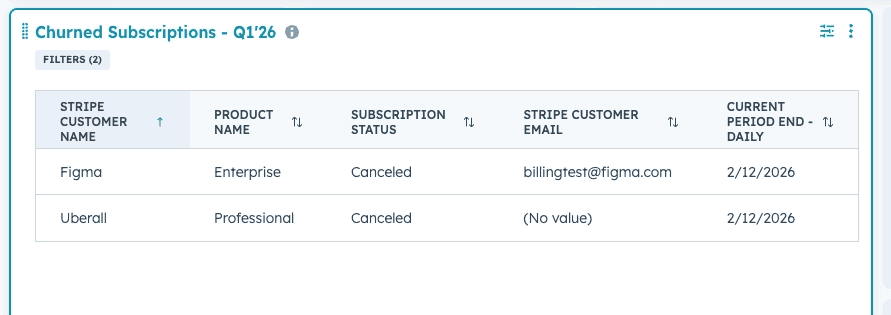
What you're building: A list of subscriptions that moved to canceled status in the current period, with context about the customer and what they were paying.
Step-by-step:
In HubSpot, go to Reports > Create Report
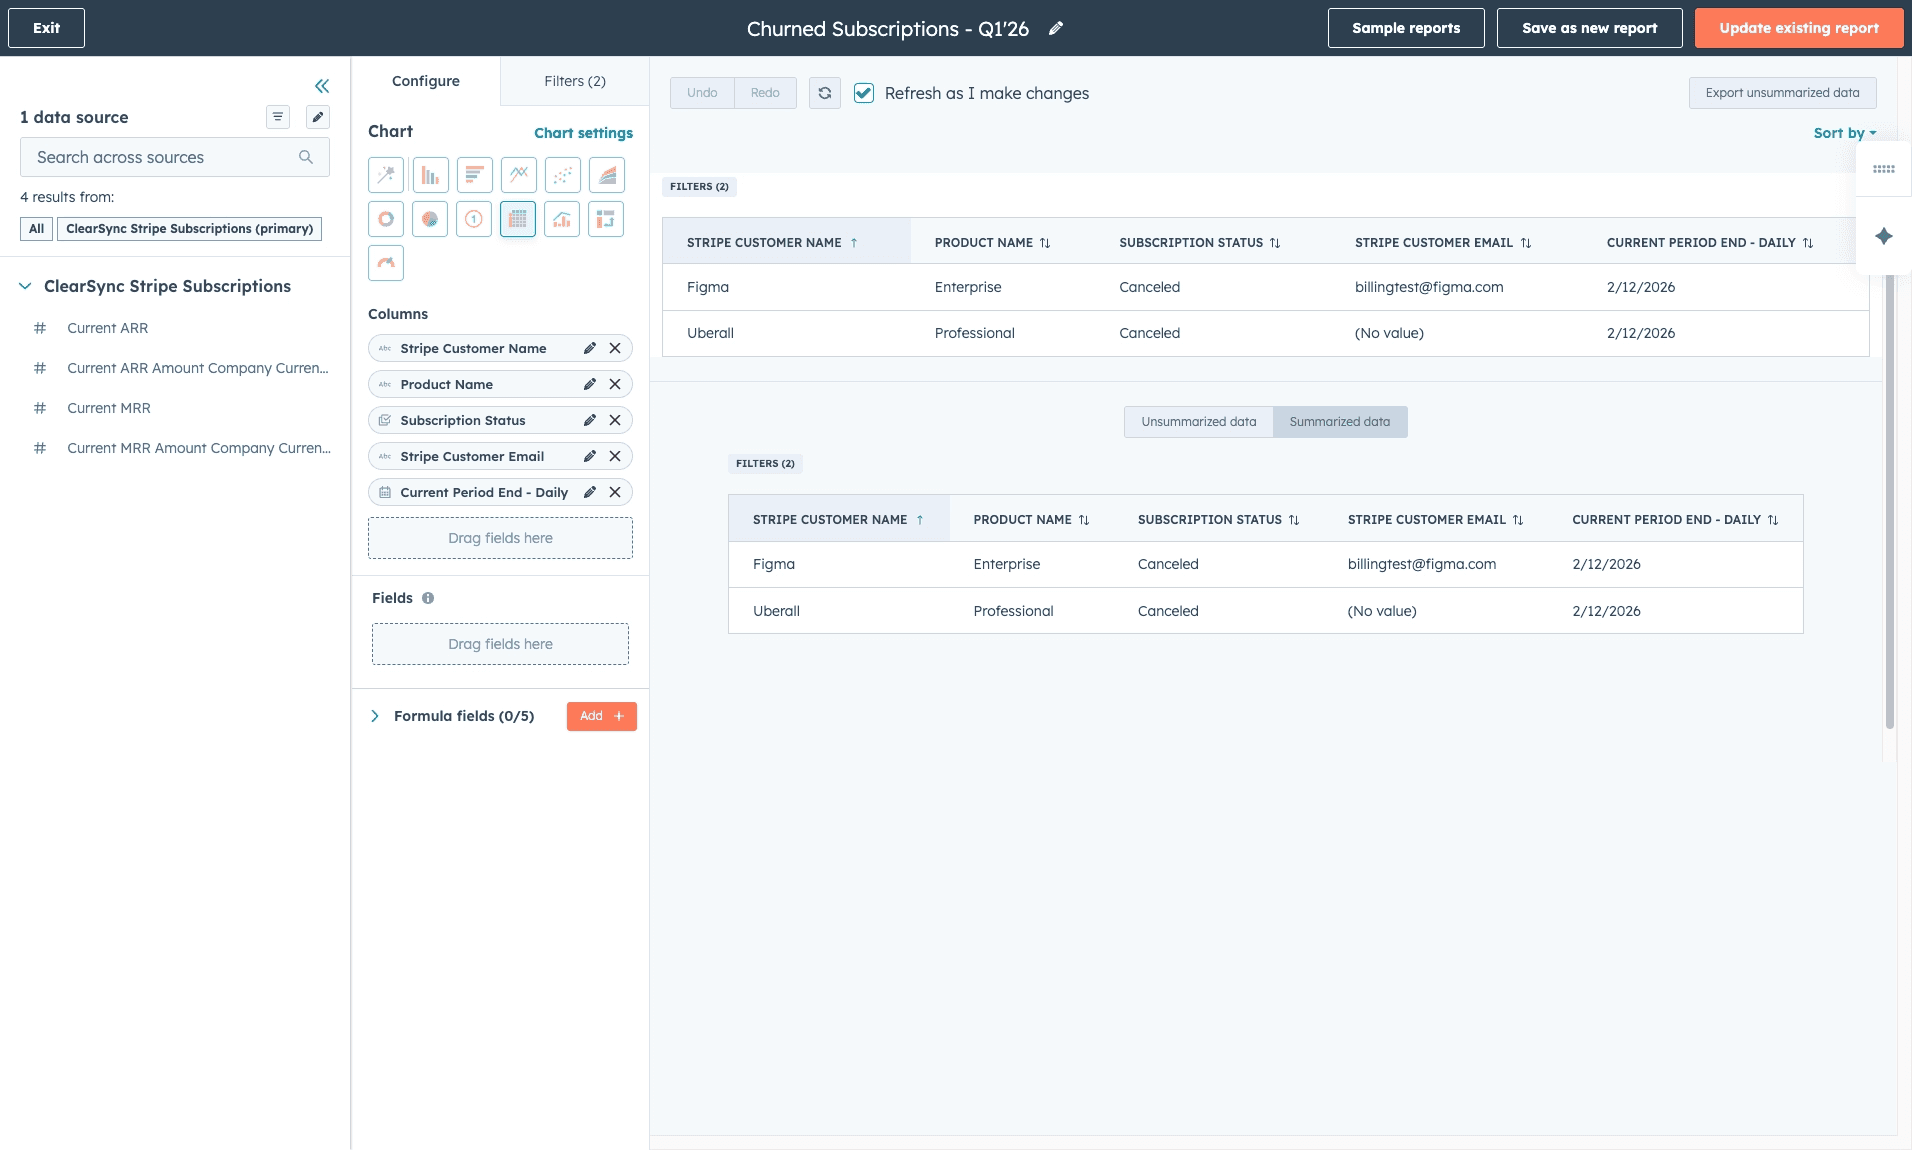
Select Custom Report Builder > Set Primary Data Source to ClearSync Stripe Subscriptions
Click Next, then configure:
(A) Chart Type: Select Table in visualization options
(B) Columns: Drag in:
Stripe Customer Name
Product Name
Current Period End - Daily (the date they canceled)
Stripe Customer Email
(C) Filters:
Subscription Status = Canceled
Current Period End is [whatever you’d like, e.g., ‘this quarter so far’]
Save as "Churned Subscriptions - [date]"
How to use this:
Review with customer success team to identify patterns (product issues? pricing concerns?)
Track which customer segments are churning (company size, industry, product line)
Calculate metrics: average MRR at churn, time-to-churn by segment
Part B: Churn Breakdown by Segment
What you're building: A chart showing where your churn is concentrated - by product line, company size, region, or any other segment that matters to your business.
Step-by-step:
Go to Reports > Create Report
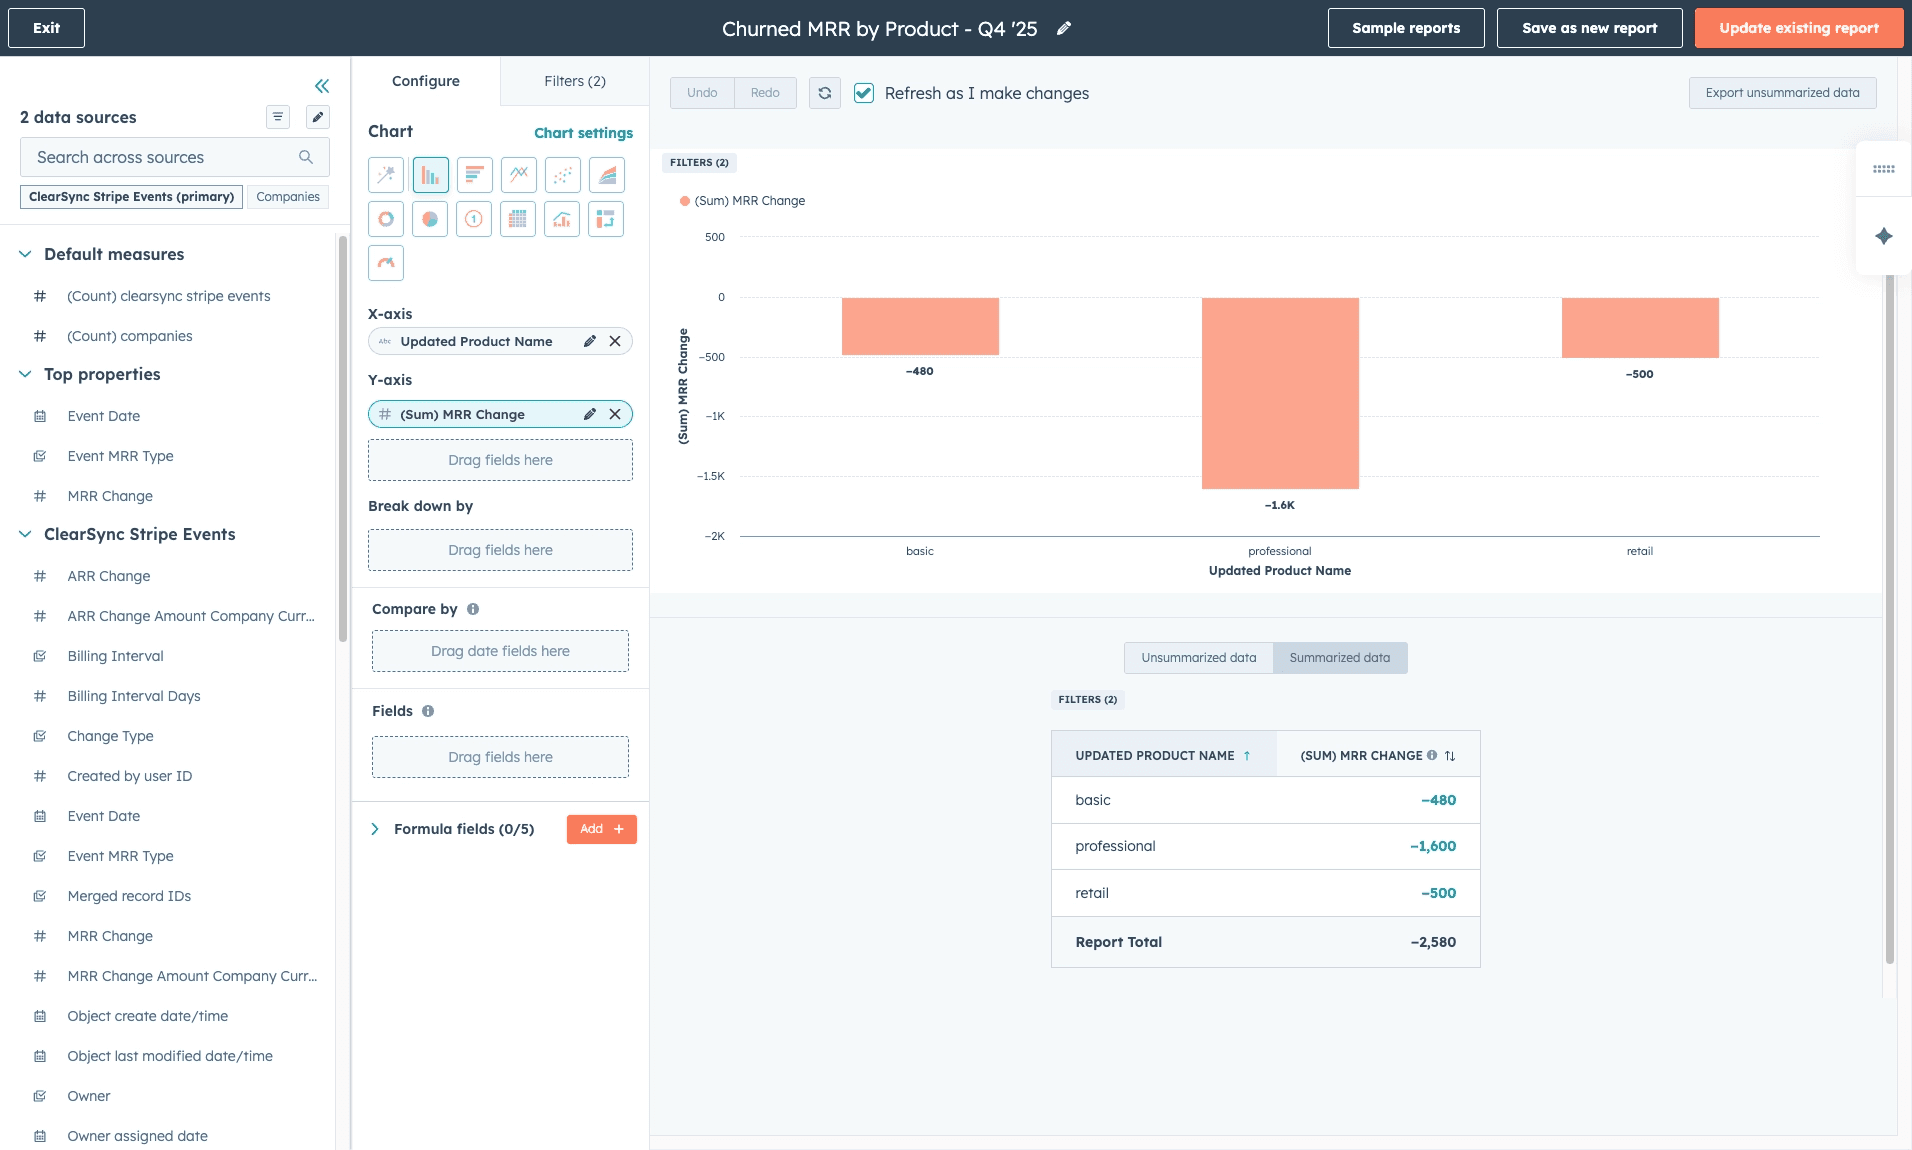
Select Custom Report > set Primary Data Source to ClearSync Stripe Events and add Companies as an additional data source
Click Next, then configure:
(A) Chart type: Select Vertical Bar visualization
(B) X-axis: Choose your segment, for example, you could choose:
Updated Product Name (which product is churning most?)
Industry (from Companies object, which industry churns the most?)
Company Size or Revenue Range (from Companies object, which company size churns the most?)
(C) Y-axis: Drag in MRR Change and set to Sum
(D) Filters:
Event MRR Type = Churn
(Optional) Event Date is [whatever you’d like, ie ‘last quarter’]
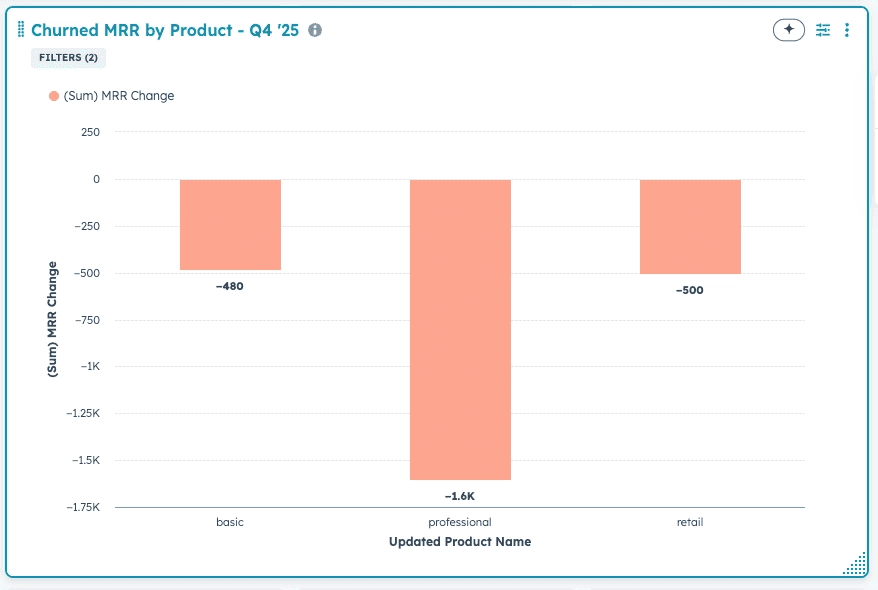
Save as "Churned MRR by Product - [time period]"
What this shows:
Example breakdown by product:
Example breakdown by product:
Basic Plan: -$480 churned
Professional Plan: -$1600 churned
Retail Plan: -$500 churned
This tells you: "62% of our churn came from Professional plan users last quarter."
Board context: The churned customers list tells you who left and when. The segment breakdown tells you where to focus retention efforts. Together, they give boards the full churn story:
"We lost $19K in churn this quarter"
"75% came from our Enterprise product"
"Here are the top 5 churned accounts and what they had in common"
This isn't churn rate (which would require knowing total customers at risk), but it shows the pattern.
Pro tip: Create multiple segment views:
Churn by product line
Churn by customer size (filter by employee count or ARR)
Churn by sales rep or CSM
Churn by region or industry
Report 5: Failed Payment List
Boards care about churn prevention. Failed payments are leading indicators; catch them early and you can save the subscription.
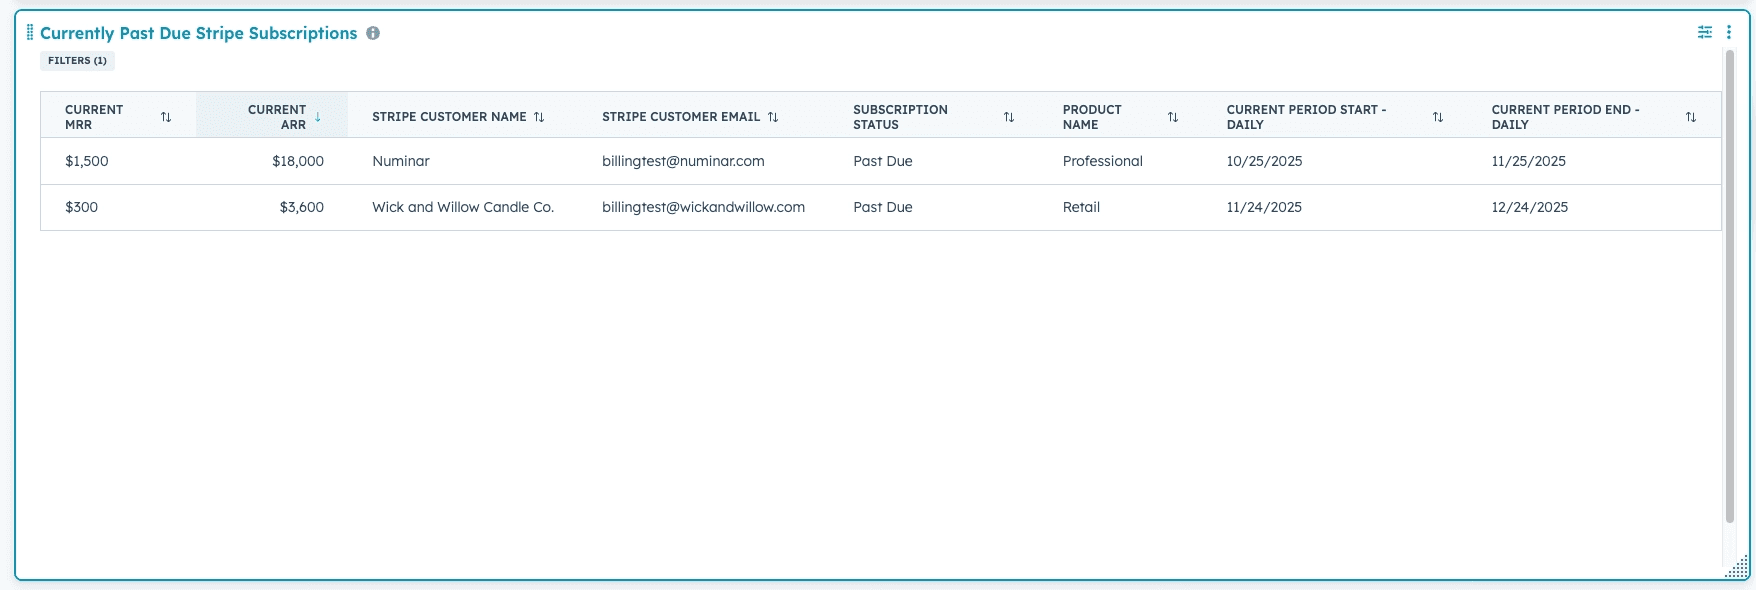
What you're building: A filtered list of all subscriptions currently in “past due” status in Stripe (meaning their payment method could not be charged), showing which customers need immediate attention.
Step-by-step:
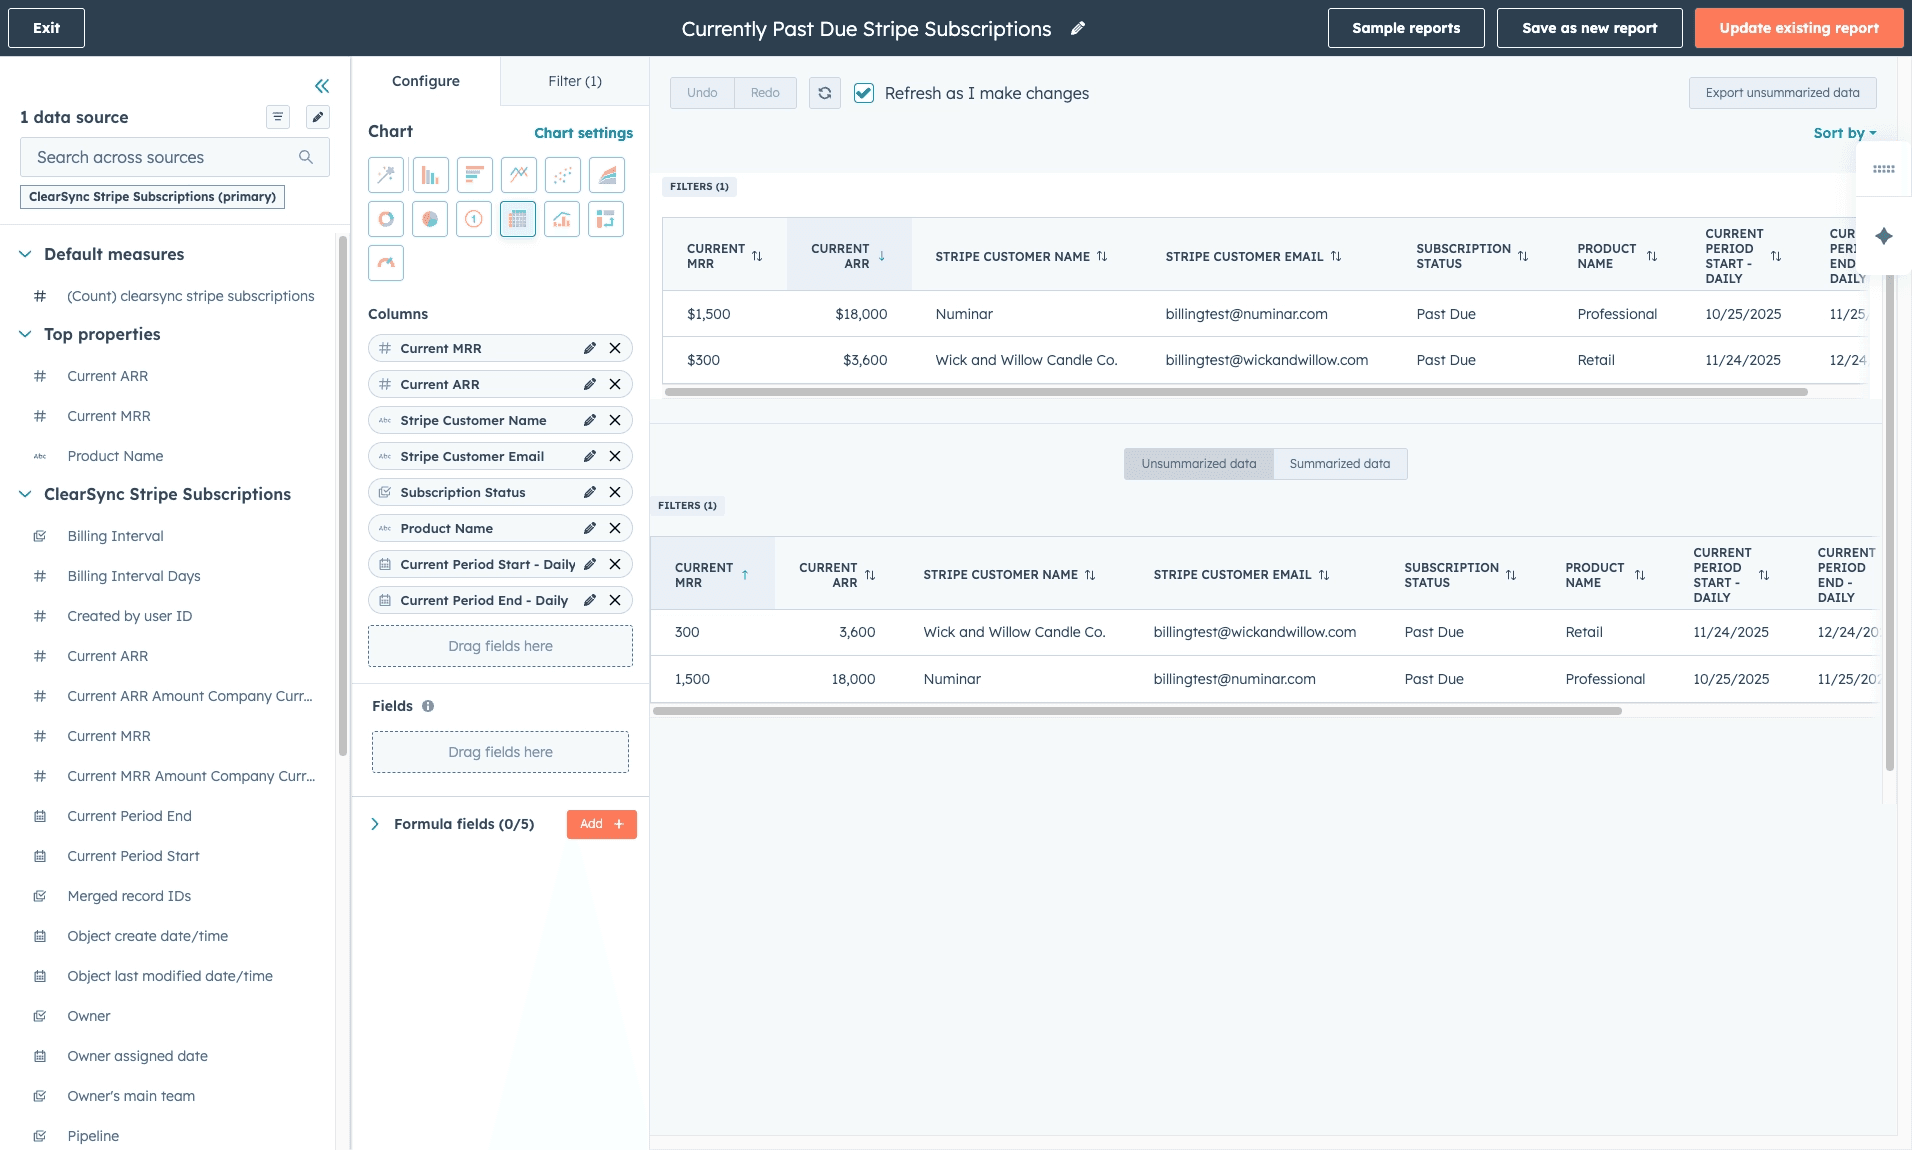
In HubSpot, go to Reports > Create Report
Select Custom Report Builder > set Primary Data Source to ClearSync Stripe Subscriptions
Click next, then configure:
(A) Chart Type: Select Table in visualization options
(B) Columns: Drag in Current MRR, Current ARR, Stripe Customer Name, Stripe Customer Email, Subscription Status, Product Name, Current Period Start - Daily, Current Period End - Daily
(C) Filter: Set to Subscription Status is any of Past Due (Your company may use “Unpaid” in Stripe as a status to track as well. Check with your team on your particular setup.)
Save as "Currently Past Due Stripe Subscriptions"
How to use this:
Share with customer success team for outreach
Set up a view sorted by MRR (tackle high-value accounts first)
Set up a workflow to automatically attempt to collect payment & alert CS owners
What makes this work: ClearSync updates subscription status in real-time as Stripe processes payment retries. When a payment fails, the subscription appears on this list within minutes. When it's resolved, it automatically drops off.
Board context: Show proactive churn prevention. This list represents revenue at risk that you're actively working to save.
Report 6: Top Customers by MRR & ARR
Every founder, team, and board wants to see: "Who are our biggest customers and how much are they worth?"
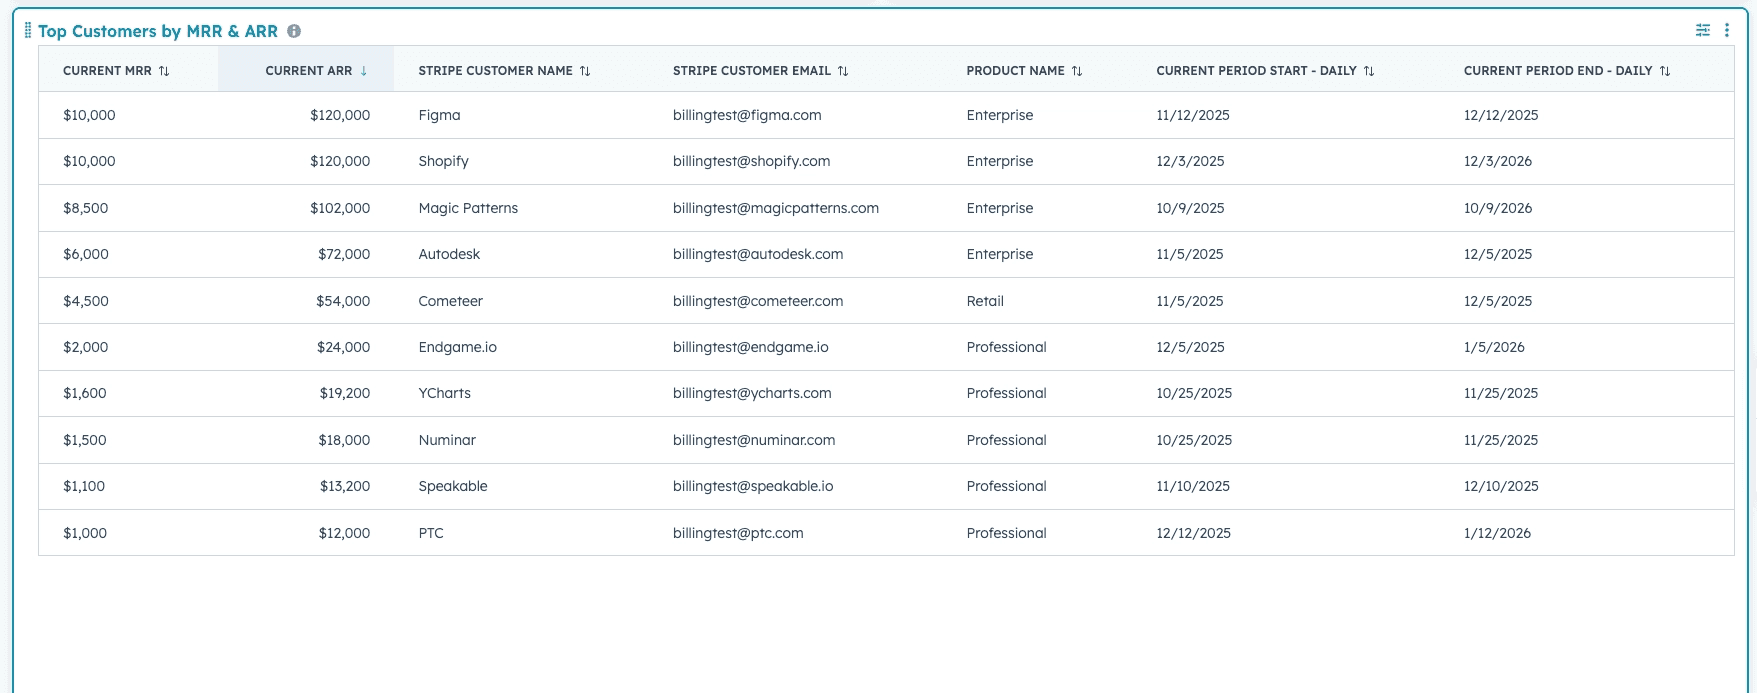
What you're building: A table showing your top customers ranked by MRR and ARR, with key details like product, renewal dates, and billing email.
Step-by-step:
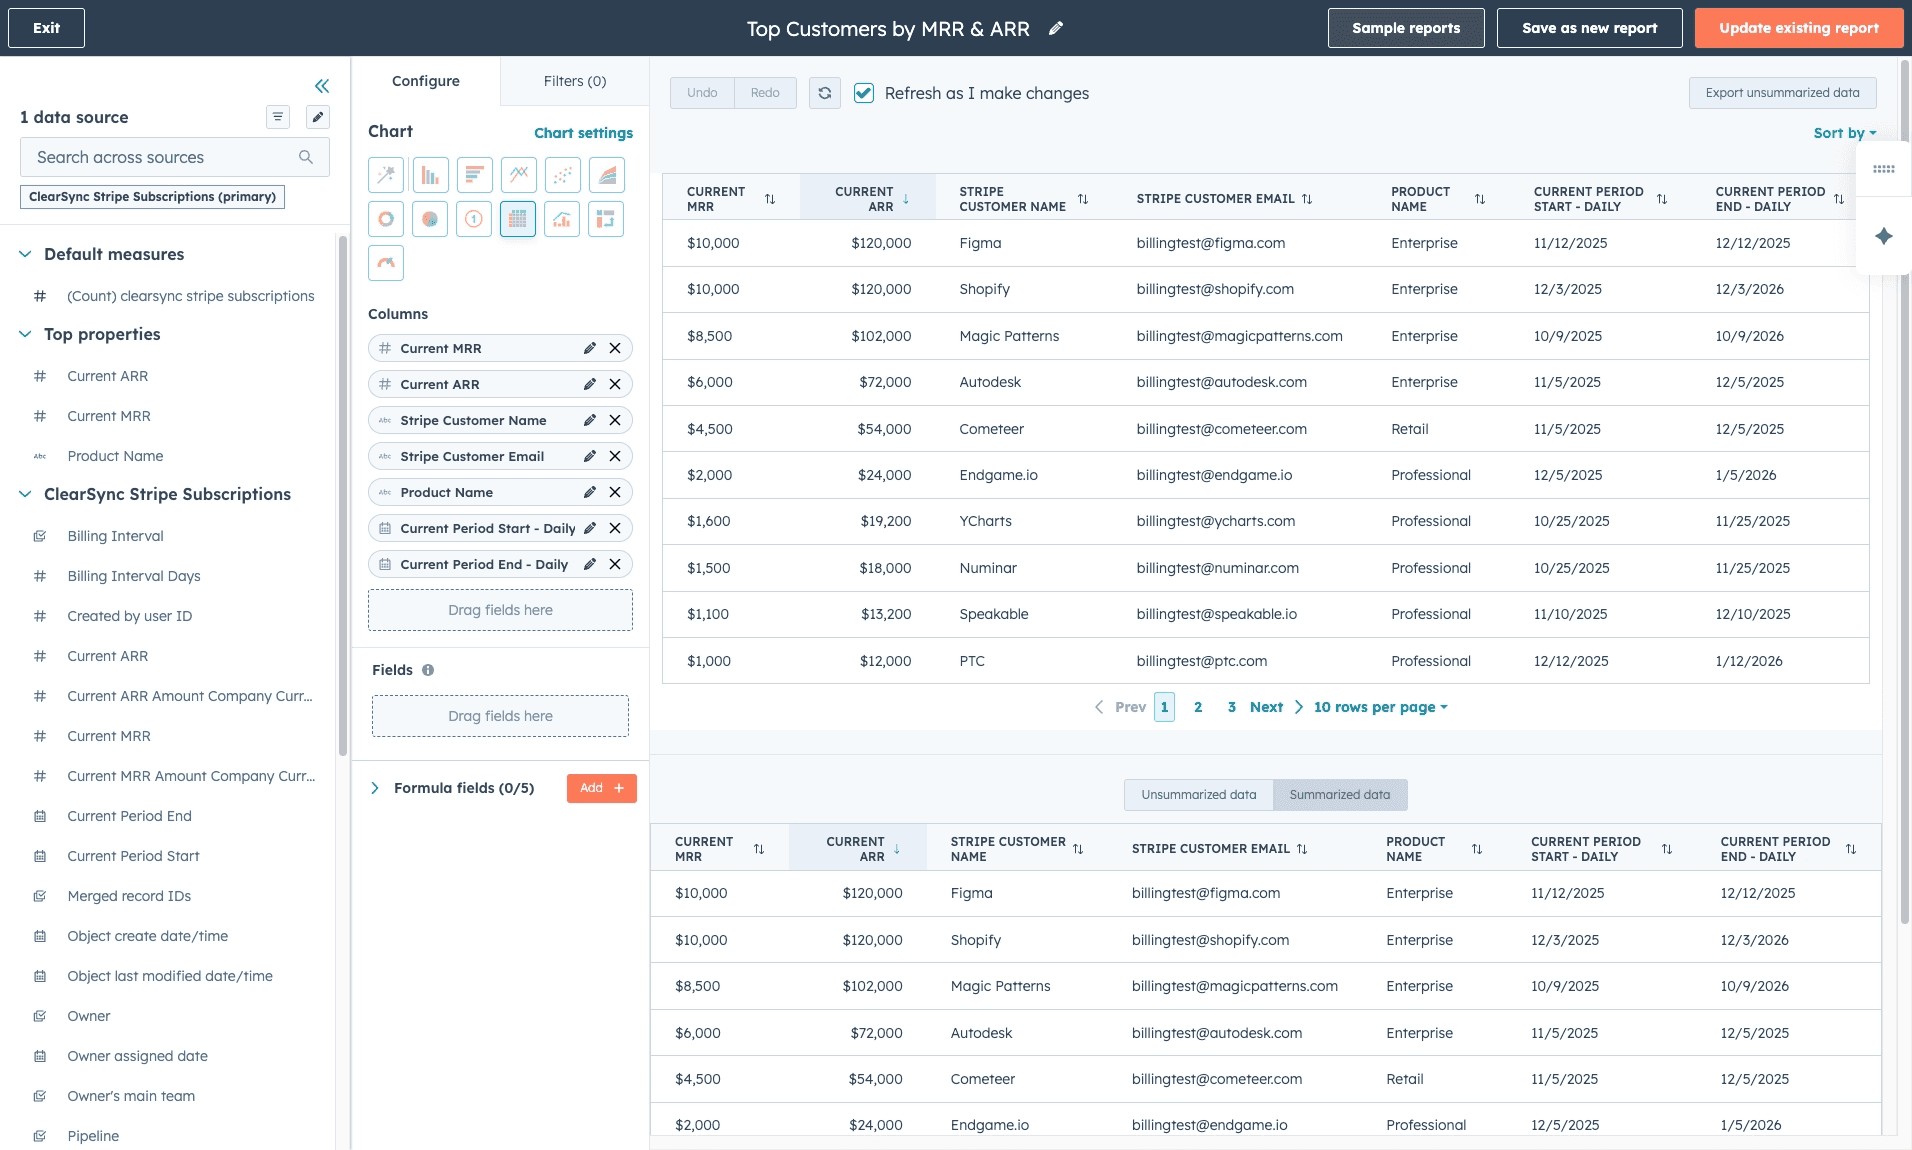
In HubSpot, go to Reports > Create Report
Select Custom Report Builder > Set Primary Data Source to ClearSync Stripe Subscriptions
Click Next, then configure:
(A) Chart Type: Select Table from the visualization options
(B) Columns: Drag the following properties into the Columns section:
Current MRR
Current ARR
Stripe Customer Name
Stripe Customer Email
Product Name
Current Period Start - Daily
Current Period End - Daily
Set up sorting by clicking Sort by at the top of the report and select Current ARR and choose Descending (highest to lowest). This puts your biggest customers at the top.
Save as "Top Customers by MRR & ARR"
What this shows:
Current MRR & ARR - How much recurring revenue each customer represents
Customer name and email - Who they are and how to contact them
Product name - What they're subscribed to (especially useful if you have multiple products)
Renewal dates - When their current period ends (critical for renewal planning)
Board context: This report answers "where's our revenue concentration?" If your top 5 customers represent 80% of MRR, that's concentration risk. If revenue is distributed across many customers, that's healthier but potentially means lower ACV. Either way, founders and boards need to know who's driving the business.
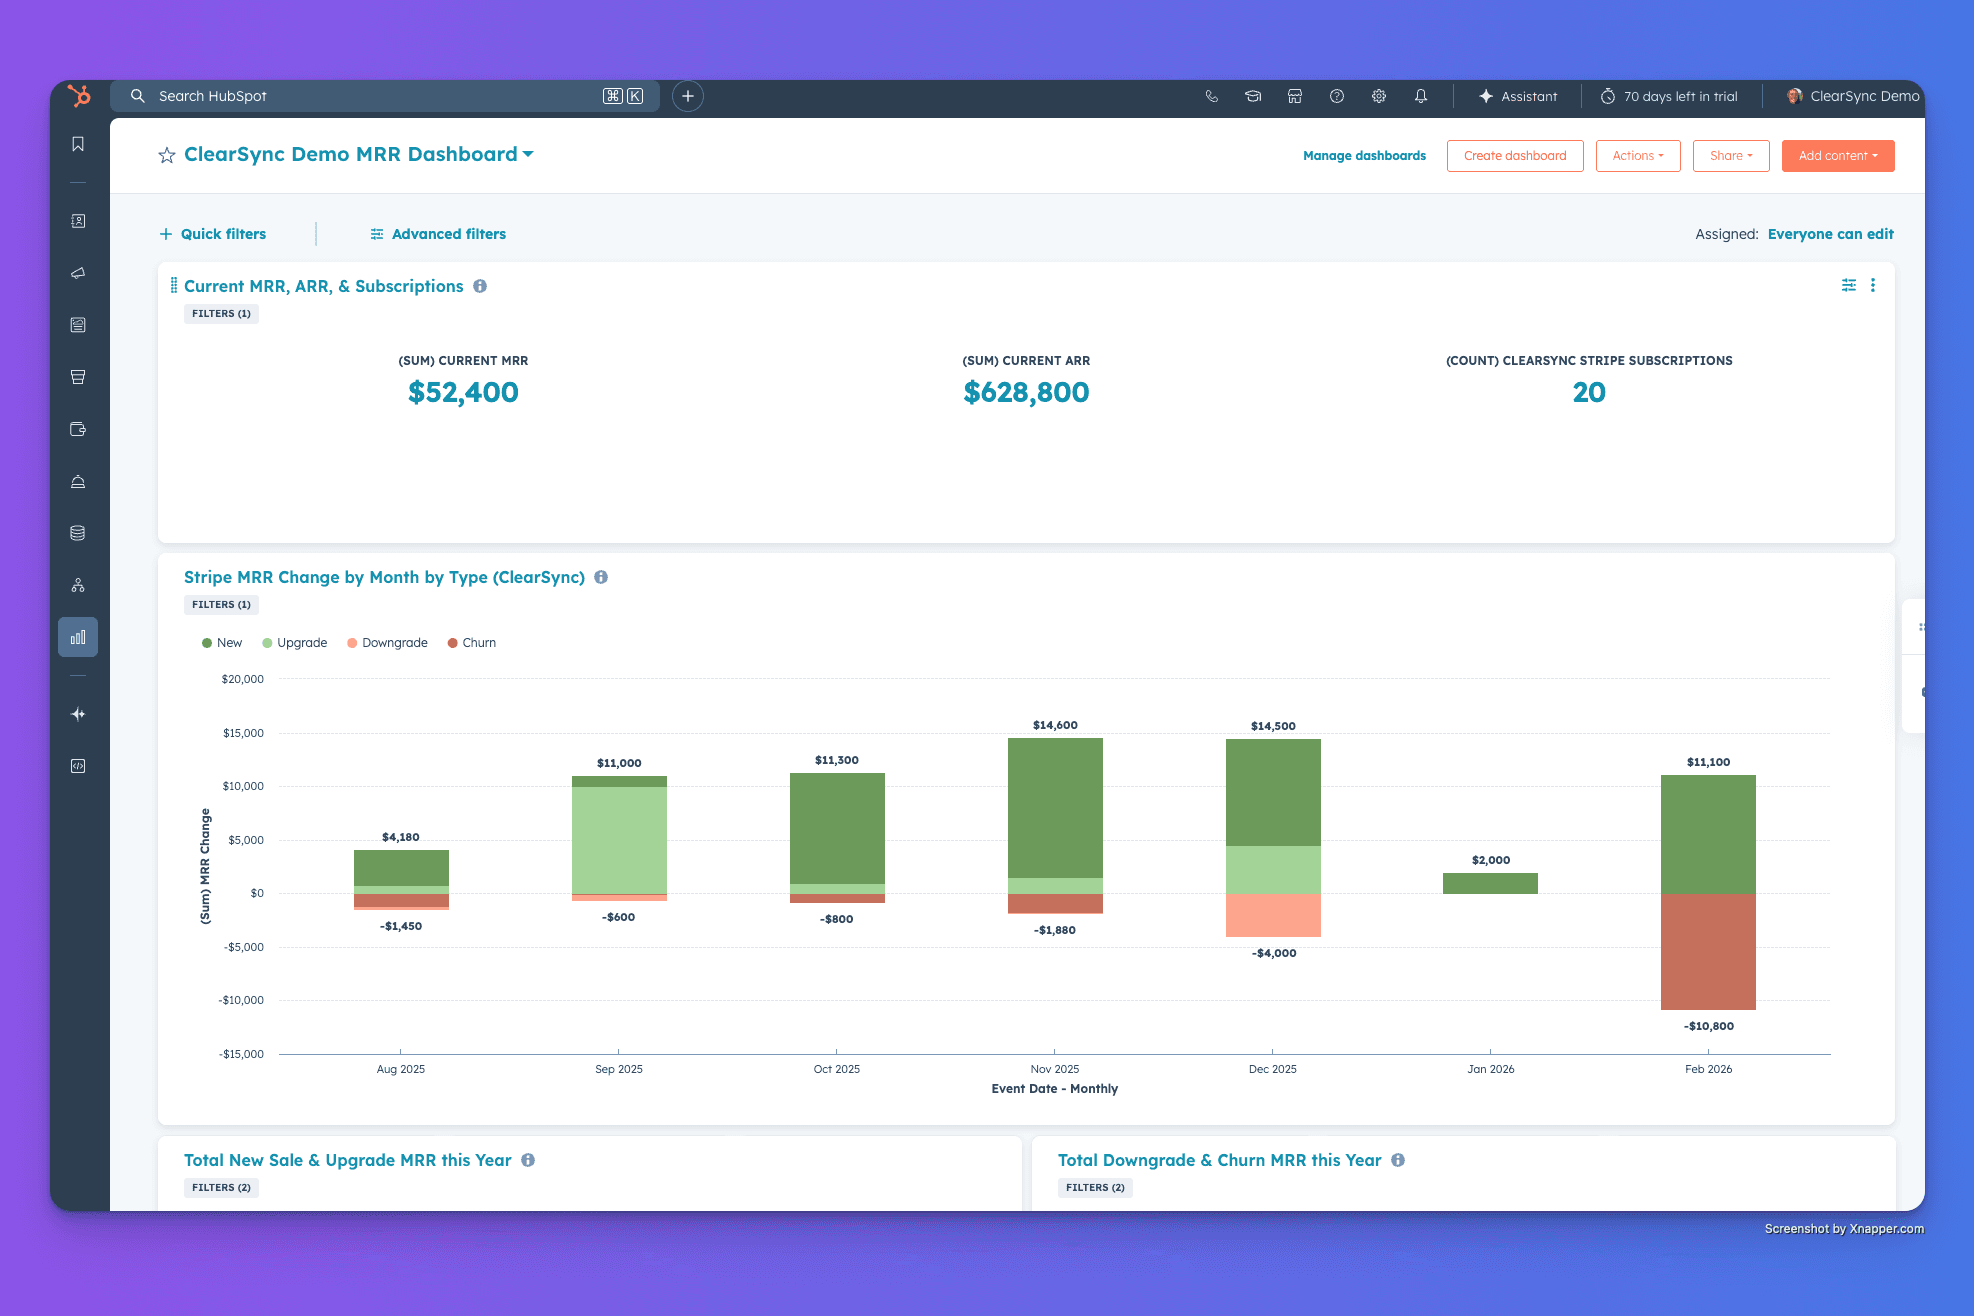
Putting It All Together: Your Board Dashboard
Now add all reports to a single HubSpot dashboard so you can answer:
Where are we? (Current MRR, ARR, customer count)
How efficient is our retention? (expansion, contraction, churn rate)
How did we get here? (Historical trends)
What's working by segment? (MRR breakdown by segment)
What needs attention? (Failed payments, top customers)
This is what boards actually want to see: headline metrics, efficiency indicators, trend context, and evidence you're managing the business proactively.
What ClearSync Data Enables in HubSpot Reporting
Let's be clear about what you're getting with this approach.
What ClearSync provides:
Clean Stripe subscription data in HubSpot with all the complexity handled (prorations, failed payments, status transitions)
The raw MRR events and subscription records you need to build these board reports
Real-time updates so your reports stay current
Historical data reconstruction so you can show trends over time
What you'll need additional tools for:
CAC (Customer Acquisition Cost) analysis: Requires marketing spend data that lives outside Stripe
Advanced churn, NRR, and cohort analysis: Tools like Baremetrics and SaaSGrid automate complex retention cohorts and are complementary to ClearSync. ClearSync gets the data into HubSpot where your GTM teams need to see it.
Financial forecasting: Revenue projections and scenario planning need dedicated FP&A tools
Benchmarking: Comparing your metrics to industry standards
The ClearsSync value: Your board data and operational data live in the same place. When you present churn rate at the board meeting, your CS team sees the exact same churned customer list in HubSpot. When you show expansion MRR, your AEs see which accounts drove it.
This isn't about replacing your entire analytics stack. It's about making HubSpot your source of truth for subscription metrics so the reports you build for quarterly board meetings are built on the same data your team uses every day to run the business.
For comprehensive SaaS analytics dashboards, use Baremetrics, SaaSGrid, or ChartMogul alongside ClearSync. For revenue operations and board reporting in HubSpot, this is your foundation.
Conclusion
These reports work because the data foundation is solid. ClearSync handles the complexity—proration calculations, historical reconstruction, status transitions, multi-currency normalization—so you can focus on building insights instead of debugging webhooks.
The entire setup takes about an hour once your Stripe data is flowing into HubSpot correctly. Start with a 14-day free trial of ClearSync, import your historical data, and build these reports this afternoon.
If you're curious about why this approach works when DIY integrations don't, read about where lightweight Stripe-to-HubSpot tracking breaks and why MRR calculations are deceptively complex.
Ready to build this? Start your free trial or talk to us about your setup.


